By Rick Tobin
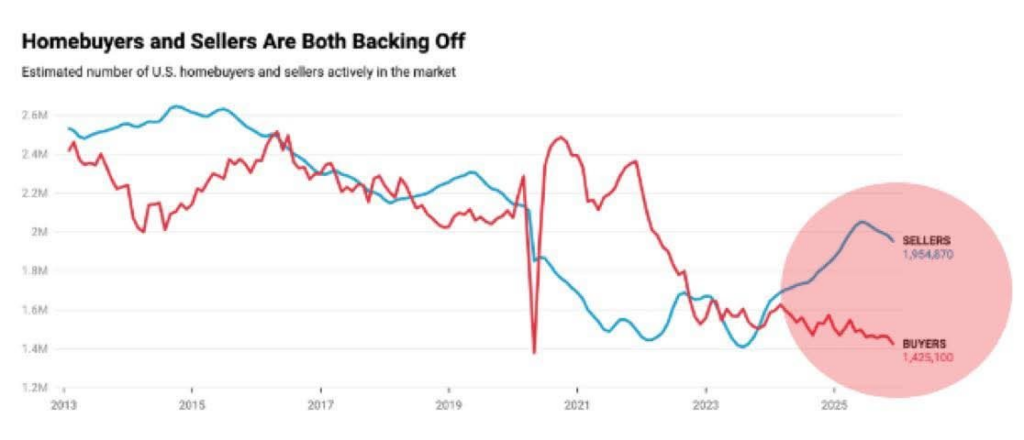
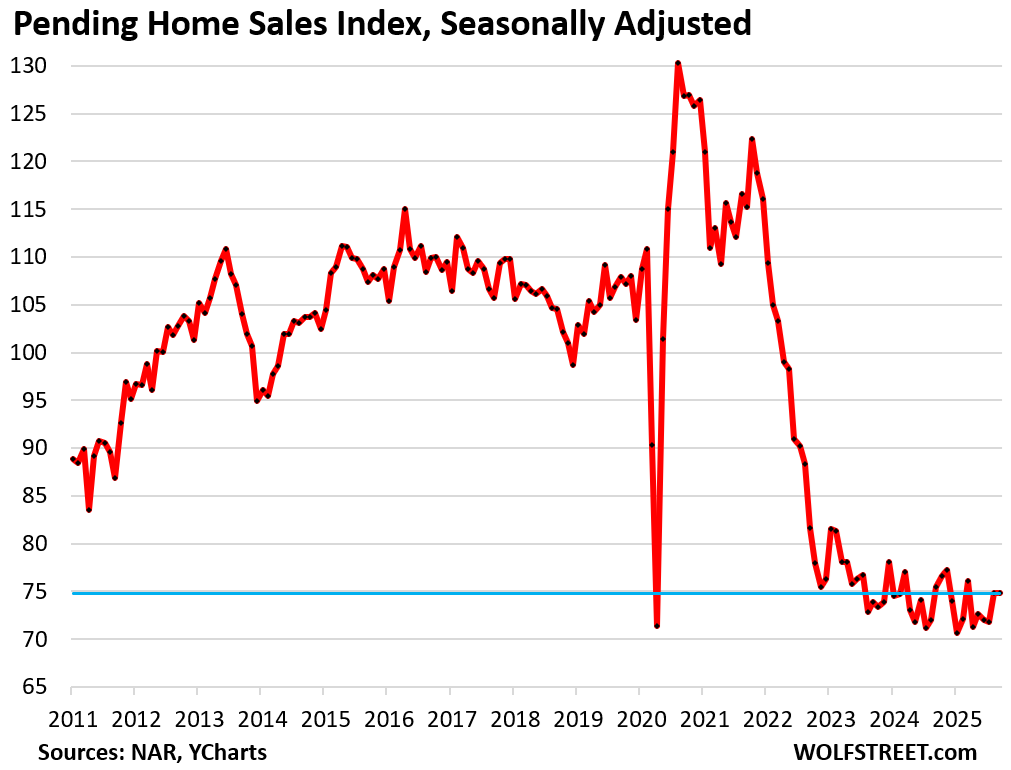
There were an estimated all-time record 600,000 more home sellers than buyers as of January 2026, according to Redfin. This is partly due to the fact that home prices are near all-time record highs in most US regions and fewer buyers have sufficient income to qualify.
However, the current national home listing inventory is still well below historical norms. A key factor for the low national home listing inventory supply is that there’s a huge number of forbearance and other distressed properties that are not being foreclosed even after years of no payments (C-19 forbearance deals for FHA and VA, especially).
article continues after advertisement

Without the foreclosure pressure, many homeowners aren’t being forced to list their homes for sale at present. At some point in the future, the distressed “shadow inventory” supply will be listed for sale or the delinquent mortgage pools will be sold off to large investment groups in bulk.
To compare the previous peak housing bubble with today’s market: There were 4,000,000 homes listed for sale as active inventory in 2007. As of February 2026, there were approximately 1.15 million home listings, according to Zillow. As a result, today’s national home listing supply is almost at 25% of the peak high back in 2007.
There are also 40 million more people across the nation today than back in 2007. Something’s got to give in the near future, whether it be falling prices, rates, and/or rising home listing inventory supplies.
Negative Economic Trends
We are now seeing some bizarre, contradictory, and negative economic and housing data trends that we’ve either never seen before or have rarely happened in the past.
For example, let’s take a closer look at what’s been happening in the first few months of 2026:
- Google searches for “can’t sell house” just hit an all-time record high.
- Google searches for “help with my mortgage” just reached a high not seen in almost 20 years, which was right near the previous housing bubble peak prior to the start of the Credit Crisis or Great Recession.
- There are an estimated 44% more home sellers than buyers across the nation, according to Redfin.
- More than 40,000 home purchase contracts, or 16.3% of every home sales deal, were canceled in December 2025. This was the highest monthly cancellation rate ever reported by Redfin.
- Early stage mortgage delinquency rates increased by almost 31% in a single year.
- More than 850,000 US homeowners are now delinquent by at least 90 days.
- Foreclosure filings are up 26% year-over-year and completed foreclosures jumped by 59%.
- In recent job market revisions, there were more than 1.2 million job cuts in 2025.
Sources: Yahoo Finance, Google Generative, Redfin, and Cotality
In one of my recent articles entitled Surviving and Thriving in 2026, I shared some concerning economic trends as well as potential new buying opportunities for investors who were both wise and brave enough to take action as opposed to many others who are sitting on the sidelines.
War, Oil Shock, and Rising Inflation
As of early March 2026, we’re now seeing military conflicts or wars breaking out in numerous nations across the Middle East. According to sources like Bloomberg, Saudi Arabia’s largest oil refinery named Ras Tanura was hit by a drone missile attack and shut down.
Numerous oil ships in the Strait of Hormuz and multiple oil-rich nations were hit by various military weapons in the first few days of March, according to sources like the Business Insider.
As a result, oil prices and other energy costs are starting to significantly rise due to the perceived lack of future supply, partly since nearly 20% of the world’s oil production comes from the Strait of Hormuz region.
Because energy price swings are usually a core factor for future inflation trends, the potentially increasing oil and energy costs may be a catalyst for rising transportation costs for consumer goods and overall inflation rates may rise at a faster pace.
Oil and energy prices could stabilize and drop again later this year, partly depending upon how long this conflict lasts. Only time will tell if energy costs will finish this year higher or lower. However, energy prices have consistently increased over the past several years and decades, so it’s more likely than not that energy costs will keep rising.
Increasing Stagflation Risks

For comparison purposes to past economic time periods, here are more details about the possibility of Stagflation risks related to oil shock that I shared in my Are Stagflation Risk Concerns Valid or Not? article from May 2025:
Stagflation is the simultaneous appearance in an economy of slow growth, high unemployment, increasing rates, and rising prices.
The last major stagflation era here in the U.S. was during the years between 1973 and 1982. Back then, energy and overall inflation rates rose so quickly that the Federal Reserve kept pushing rates higher in order to cool or “quash” inflation and unemployment rates rose as well.
For example, the Fed increased their Fed Funds Rate from 6.75% in January 1978 to 10.25% in April 1979 and later to 20% in December 1980. The U.S. Prime Rate for the most creditworthy borrowers also peaked at 21.5% starting in December 1980 and the 30-year fixed mortgage rate hit 18.6% in October 1981.
Generally, energy price swings are a root cause of overall inflation trends up or down. This is partly due to the fact that our transportation supply chain (ships, trucks, airplanes, trains, etc.) is so heavily dependent upon various types of fuel to deliver consumer goods.
article continues after advertisement

The Oil Shock Crash of 1973 was a key factor or catalyst for this stagflation era:
1973 – Oil Shock Crash: This was directly related to the end of Bretton Woods when the “gold standard” was switched to the Petrodollar (“oil for dollars”) system beginning earlier in 1971. Between October 1973 and January 1974, oil prices quadrupled within just a few months due to the ongoing OPEC (Organization of Petroleum and Exporting Countries) Embargo, or the reduction in oil production, increasing U.S. demand, and skyrocketing oil prices for consumers.
Could you imagine if the 30-year fixed mortgage rate later surpassed 10%, 15%, or even 20% like back during the late 1970s and early 1980s. If so, it would really cool the housing market and overall economy, while inspiring more sellers to learn about creative seller-financing techniques that I’ve written about for the past few decades.
Here in Southern California, I’ve paid more than $5 per gallon of gas over the past few months. If the world’s oil supply drops later this year, how much higher will our California gas prices go along with the rest of the nation?
Small Business Challenges & Loan Options

Small businesses in the United States employ somewhere between 45.9% to 46.4% of all private-sector workers, which equates to roughly 59 to 62 million people. While these small businesses represent more than 99% of all employment across the nation, their share of US employment is just under half of the US workforce, as per the Pew Research Center.
We’ve all seen insurance, property taxes, taxes, food costs, automobile expenses, and other consumer goods and services prices rise quite a lot since 2019.
Unfortunately, many small businesses can’t afford to raise their prices enough for their customers to pay to cover their rising costs as their net profit margins may be declining or going negative.
More and more small business owners are operating off of much larger credit card balances with rates that may vary between 22% and 40%+ APRs (Annual Percentage Rate) that help them cover their day-to-day business expenses.
Other small business owners are borrowing from even more expensive loan options that are called Merchant Cash Advance Loans (or future credit card sales payment advances) with APRs ranging from 25% up to more than 350% APRs.
By comparison, the early paycheck advance loans for employees have shockingly high rates of between 300% and 2,000% APRs.
How do these lenders not violate usury laws with these horrific loan rates and fees that are negatively impacting so many small business owners and employees?
Business Loans from Realloans
Our Realloans team also offers very flexible and much more affordable business loan solutions for our clients such as follows:
- $100,000 to $15 million dollar business loans
- No tax returns or collateral required
- Qualify off of at least 1-year gross cash flow.
- Quick closings that can be as short as 14 days.
- Our team can help repair credit as we work on the loans.
- Credit lines, subordinate debt, and equipment financing available.
For more details about Business Loans from Realloans, please visit our Realloans.com website or Facebook page here: Realloans on Facebook.
Home Price Swings & New Buying or Selling Opportunities
The possibility of both higher energy and inflation costs later this year can also boost home values that are hedged against inflation. Home values have historically risen more than twice as high as published inflation rates in all 50 states over the past 50 years, as I’ve shared before.
In some US regions, there will be incredibly discounted property buying deals. In other regions, sellers may still collect all-time record high prices for their properties.
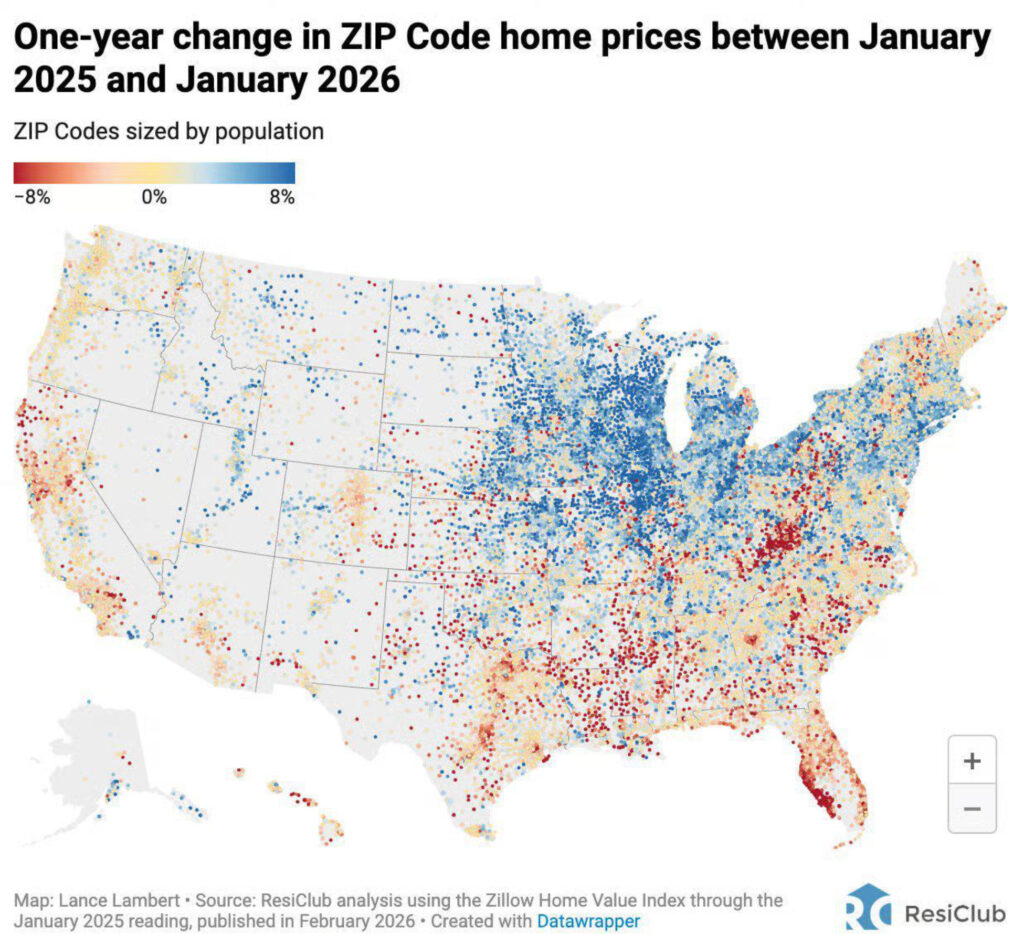
The brilliant minds at ResiClub recently shared a detailed analysis of one-year price changes by zip code regions between January 2025 and January 2026.
Do you live in a red (-8%), tan (near 0%), or blue (+8%) home region as it relates to 12-month price trends between January 2025 and January 2026?
At present, the Midwest region seems to have the highest concentration of home price gains, while Florida has the largest number of negative home price swings.
The more chaotic the economy this year and beyond, the more opportunities there will be for educated buyers and sellers who are brave enough to take a leap of faith by jumping in feet first and wise enough to know how to minimize the risks and maximize their returns at the same time.

Rick Tobin has worked in the real estate, financial, investment, and writing fields for the past 30+ years. He’s held eight (8) different real estate, securities, and mortgage brokerage licenses to date and is a graduate of the University of Southern California.
Rick provides creative residential and commercial mortgage solutions for clients across the nation. He’s also written college textbooks and real estate licensing courses in most states for the two largest real estate publishers in the nation; the oldest real estate school in California; and the first online real estate school in California.
Please visit his website at Realloans.com for financing options, join his investment group at So-Cal Real Estate Investors, and follow his new So-Cal Real Estate TV channel for more details.
Rick Tobin
Realloans (Real Estate Loans)
https://realloans.com/
Phone or Text: (760) 485 – 2422
NMLS 1934868
Equal Housing Opportunity / Equal Housing Lender
To quickly apply online: Loan Application
For our real estate course: Learn Real Estate
Please follow our new real estate channel (watch on television, computers, and phones): So-Cal Real Estate TV
Our Facebook business pages: Realloans, Inside Los Angeles, Inside Pacific Palisades, Inside Long Beach, Inside Huntington Beach, Inside Orange County, Inside La Jolla, Inside San Diego, Inside Lake Elsinore, Inside Temecula Valley, Inside Coachella Valley, and So-Cal Real Estate Investors.
Here are some of my articles: The Fall of 2025 and Rise of New Opportunities, The Intersection of Declining Home Sales and Creative Marketing, Are Lower Rates on the Horizon?, Weather Extremes, Homes, and Insurance Risks, The California Gold Rush Boom, and Are You Focused on Commercial Real Estate?
Please join my So-Cal Real Estate Investors group that meets at Canyon Lake Golf & Country Club, Shoreline Yacht Club in Long Beach, and online: So-Cal Real Estate Investors.