By Rick Tobin
Property tax and homeowners insurance payments have risen so much in many U.S. regions that the monthly property tax and homeowners payments can both be as high as an average mortgage payment. It’s truly a pity that the monthly PITI (Principal, Interest, Taxes, and Insurance) payments have reached unaffordable levels for so many homeowners across the nation.
An analysis by Lending Tree that was published and updated in May 2025 found the median property taxes across the nation rose by an average of 10.4% between 2021 and 2023.
Whether or not a homeowner owns their property with or without a mortgage, they must continue to pay at least their property tax payments or risk losing the residential or commercial property to a future foreclosure tax sale.
By comparison, the decision to hold a homeowners or landlord insurance property on a free and clear property is solely up to the property owner who is willing to take the risk associated with fires, floods, and other damaging events. Many landlords today with free-and-clear properties may also have negative cash flow, so they stop paying for insurance.
article continues after advertisement

Property Tax Trends
Let’s take a closer look at what was gathered, analyzed, and shared by both Lending Tree and the Tax Foundation as it relates to property tax and homeownership trends through 2023:
● U.S. homeowners paid a median property tax payment of $2,969 annually, or about $247 per month.
● Homeowners without a mortgage can select insurance policies with lower coverage limit amounts because they don’t have to also protect a mortgage lender on the same policy. As a result, the annual premium amounts are usually lower for homes with no mortgage debt.
● Homeowners without a mortgage for their free-and-clear properties paid a median of $2,474 in annual property taxes, while those with a mortgage paid almost $869 more per year at a median of $3,343.
● More than 40% of U.S. homes today are now owned without a mortgage. Some of these homeowners choose not to obtain any insurance for their properties to keep expenses low. In theory, this may make sense until a future firestorm or horrific flooding situation damages their property so severely that they must tear it down.
Low and High Property Tax Regions

Depending on the price paid and the tax assessment percentage rate for the subject property’s county region, annual property taxes paid can vary from $1,000 to $100,000+ per year.
Between 2021 and 2023, property taxes increased in each of the 50 largest metro regions. The three metropolitan regions with the lowest annual property tax payment increases were as follows:
1. Pittsburgh, PA: +4.4%
2. Philadelphia, PA: +8.2%
3. Milwaukee, WI: +8.3%
Conversely, the three metropolitan regions with the highest annual property tax increases were located here:

1. Tampa, FL: +23.3%
2. Indianapolis, IN: +19.8%
3. Dallas, TX: +19.0%
This same Lending Tree study found that among the 50 largest metropolitan areas, Birmingham, Alabama, had the lowest median annual property taxes at $1,091 per year. Memphis, Tennessee and Louisville, Kentucky had the second and third lowest annual property tax payments out of the 50 largest metro regions at $1,856 and $1,912, respectively. Amazingly, Birmingham’s annual property tax payments were 41.2% lower than the #2 lowest annual property tax region in Memphis.
Among the 10 metros with the highest annual property taxes, four are located in California and two are in Texas. Out of the large 50 metros, these three regions have the highest annual median property taxes:

1. New York, NY: $9,937
2. San Jose, CA: $9,554
3. San Francisco, CA: $8,156
Birmingham, Alabama and Phoenix, Arizona pay the smallest percentage of their home value in property taxes out of the 50 largest metropolitan regions at an effective tax rate of just 0.48%. Both Las Vegas and Denver pay slightly higher amounts at 0.50%.
Surprisingly, Buffalo, New York (2.11%), Chicago (2.08%), and Cleveland (1.74%) had the three highest effective tax percentage rates out of the top 50 metropolitan regions.
Property Taxes by County
Within each state, counties can assess different property tax percentage rates and special assessments that can increase or decrease the property taxes paid by each homeowner. Sometimes, counties or county equivalents can run out of cash and file for bankruptcy. If so, they may increase the property tax percentage rates owed to help cover their annual budgets for schools, roads, and other expenses.
Lowest Property Taxes
In 2023, the lowest annual property tax bills in the nation were found in 11 counties, or county equivalents (parishes, boroughs, etc.), with median property taxes of less than $250 per year, according to the Tax Foundation.
These counties, or county equivalents, had property tax amounts at $250 per year or less, as follows:
● Alabama: Lamar and Choctaw counties
● Alaska: Northwest Arctic Borough, the Kusilvak Census Area, and the Copper River Census Area
● Louisiana: Allen, Avoyelles, Madison, Tensas, and West Carroll parishes
● South Dakota: Oglala Lakota County
In many regions of Alaska, there are actually $0 property tax payments due each year. As such, these areas in Alaska would officially have the lowest property tax rates and payments in America.
article continues after advertisement

Highest Property Taxes
Now, let’s review the 16 counties with the highest median property tax payments in the nation that all have annual tax bills exceeding $10,000 per year:
● California: Marin County
● New Jersey: Bergen, Essex, Hunterdon, Monmouth, Morris, Passaic, Somerset, and Union counties
● New York: Nassau, New York, Putnam, Rockland, Suffolk, and Westchester counties
● Virginia: Falls Church City
Additionally, two counties in New Jersey (Hudson and Middlesex), three counties in California (San Francisco, San Mateo, and Santa Clara) and the Western Connecticut Planning Region in Connecticut have annual median property taxes above $9,000 and slightly below $10,000.
Reasons for Increasing Property Taxes
Property taxes are the primary tool for financing local governments. For example, property taxes comprised 27.4% of total state and local tax collections in the U.S., which was more than any other tax revenue source.
Property taxes collected are then used to fund schools, police departments, fire and emergency medical services, roads, and other services. As a percentage of local tax collections in regions like counties, property taxes accounted for more than 70% of local tax collections in fiscal year 2022.
Rapidly increasing salaries, underfunded pension needs, and overall county budget increases for county employees are also reasons why property taxes are going higher to cover these budget deficits.
Because home prices have reached all-time record highs in many U.S. regions, the corresponding property tax assessments have risen as well because they are based on the home purchase price or latest assessed value.
Skyrocketing Insurance Costs
Sadly, insurance costs are seemingly increasing at an even faster pace across the nation than property taxes and monthly mortgage payments.

It’s not uncommon these days for homeowners or landlords to pay $500, $1,000, $2,000, or $5,000+ per month (not year) to have sufficient insurance coverage that protects them and their mortgage lender.
As I’ve shared in past articles like The Drying Disaster-Relief Insurance Pools, a large number of insurance companies and government agencies that back insurers may be technically insolvent after several decades’ worth of costly and deadly firestorms, floods, hurricanes, tornadoes, and other natural or manmade events.
California’s own “insurer of last resort” named the FAIR Plan had upwards of $336 billion of property exposure a year ago with just a cash surplus between $300 and $700 million, as per the California Assembly Insurance Oversight Committee.
This FAIR Plan budget analysis took place well before the absolutely horrific firestorms that hit my former neighborhood of Pacific Palisades and Altadena near Pasadena, which I shared back in January 2025 one week after the firestorms hit these beautiful regions as I shared in my Steps to Recover from the Pacific Palisades Firestorm article.
There are 10 times more California homes in low-fire risk zip code regions than homes in high-fire risk regions that currently have much more expensive California FAIR (Fair Access to Insurance Requirements) Plan insurance, according to CBS News Los Angeles.
Fire Hazard Severity Zones (FHSZ) & Local Responsibility Areas (LRA)
On March 24, 2025, OSFM (Office of the State Fire Marshal) issued the 2025 Recommended Local Responsibility Area (LRA) FHSZ maps for California.

FHSZ Classification
Properties are designated as Moderate, High, or Very High Fire Hazard Severity Zones based on:
● Terrain and topography
● Vegetation and fuel conditions
● Fire history and frequency
● Climate and weather patterns
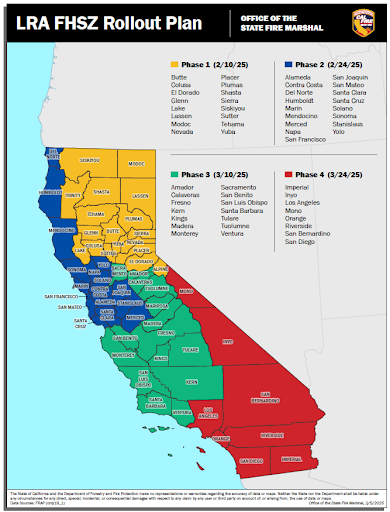
As a result of the issuance of this map, a large number of homeowners in California are losing their insurance and have no other option to choose from than the usually more expensive FAIR Plan.
Just recently, the California FAIR Plan proposed the raising of home insurance rates by an average of 35.8% starting next spring in 2026, according to this article by the San Francisco Chronicle. If this hike request is approved by the state, it would be the largest payment increase in at least seven years.
However, approximately half of California FAIR Plan customers might experience annual rate increases of 40% to 50%, while other customers could see their rates jump by more than 300%.
The Lock-In Effect
I’ve written about the lock-in effect over the years as it primarily relates to homeowners who didn’t want to sell or refinance their record low mortgage rates.
It’s not just homeowners who hold near record low 30-year fixed mortgage rates who are not motivated to sell their homes whether or not they can afford the monthly payments. Rather, a large number of homeowners today aren’t selling their homes because of factors such as fear of higher future property taxes if they acquire a more expensive home.
Many homeowners also don’t want to pay higher insurance and/or lose their low fixed rate mortgage that might be somewhere between 3% and 5%. Other homeowners are afraid to make any claims on their insurance policies even if completely justified because they don’t want to risk losing their insurance or seeing their annual premium payments double or triple.
As a result, the lock-in effect also applies to a combination of mortgage rate, insurance, and property tax swings that may be almost impossible for the average homeowner to afford if they decided to sell their home.
It’s somewhat akin to a deer-in-the-headlights type of frozen reaction for many homeowners where they don’t know what to do and the safest decision may be to sit tight and do nothing. Yet, the same holds true for potential buyers who are currently renting. Can they afford these rising mortgage, tax, and insurance payments?
At some point, home prices will be affected, for better or worse, when the number of sellers exceeds buyers or the number of buyers exceeds available home listings.

Rick Tobin
Rick Tobin has worked in the real estate, financial, investment, and writing fields for the past 30+ years. He’s held eight (8) different real estate, securities, and mortgage brokerage licenses to date and is a graduate of the University of Southern California. He provides creative residential and commercial mortgage solutions for clients across the nation. He’s also written college textbooks and real estate licensing courses in most states for the two largest real estate publishers in the nation; the oldest real estate school in California; and the first online real estate school in California. Please visit his website at Realloans.com for financing options and his new investment group at So-Cal Real Estate Investors for more details.
Learn live and in real-time with Realty411. Be sure to register for our next virtual and in-person events. For all the details, please visit Realty411.com or our Eventbrite landing page, CLICK HERE.