Crowne Plaza Costa Mesa Orange County by IHG Costa Mesa, CA
Saturday, September 26 • 10 AM – 4 PM
Overview
Network with Fantastic Companies and Like-Minded Real Estate Investors from throughout California and the Nation at Realty411’s Latest Event

GAIN INSIGHT ON THE REAL ESTATE MARKET – NETWORK WITH SOPHISTICATED INVESTORS -LEARN FROM INDUSTRY PROFESSIONALS – WE HAVE DECADES OF REI EXPERIENCE
Join Hundreds of Real Estate Investors from Throughout California & Out of State in beautiful Costa Mesa, California.
It’s time for another REALTY411.com Summit where the latest knowledge, strategies, and information on real estate investing is shared. Be sure to reserve your tickets to our latest special event: “Realty411’s News, Trends & Strategies Summit“. This one-day impactful conference is designed to help guests achieve success in real estate investing and beyond.
Join us on Saturday, September 26th, starting at 10 AM. DOORS OPEN AT 9:30 AM.
Be sure to attend this one-day complimentary event featuring timely REI insight, top educators, and active investors from locally and out of state. Friends, join us early for best seating and networking.
Our first session will begin at 10 AM promptly. Parking and admission are FREE.
Real estate investors, agents/brokers, private lenders, entrepreneurs, property managers, wealth builders and business owners… this event is designed just for YOU.
Discover the latest insight, news, and REI strategies at “Realty411’s News, Trends & Strategies Summit” on Saturday, September 26th, 2026. Realty411 has been hosting events in California and nationwide for nearly 20 years with over 14,000 guest registrations, according to Eventbrite statistics.
This is the place to be to network with sophisticated investors from across California and the nation! Our hosts and educators are investors who work full-time in the business of rehabbing, landlording, managing rentals, developing housing, and more.
Connect with investor-friendly agents/brokers and private lenders, plus other real-estate service providers. It’s all at Realty411’s NEW Summit in Orange County, California – Don’t delay, be sure to register today as seating is limited.
“Realty411’s News, Trends & Strategies Summit” is being held at:
CROWNE PLAZA COSTA MESA ORANGE COUNTY, 3131 Bristol St, Costa Mesa, CA 92626 PHONE: (714) 557-3000. The venue is located near John Wayne Airport.
For those investors interested in upgrading their experience, please purchase a VIP ticket, which includes: A gift bag with a free book on investing, multiple magazines, delicious food, and a private virtual session after the event. Plus, members have access to Realty411VIP.com, which is our money-saving website.
SOME OF OUR RECENT TOPICS HAVE INCLUDED:
- Learn How to Exit a Corporate Job and Close Millions in Real Estate — As an agent/broker or an investor — We have experts in both areas.
- Find Local Pre-Developed Real Estate Investment and Land Banking Deals
- Discover Opportunities in Commercial Development in Southern California
- The Latest News on Property Financing With Experienced Brokers & MLOs
- 5-Step Business Funding to Get $350,000 in Bank Credit Lines in the next 120 Days
- What Loan Officers Need to Know about Non QM Loan
- Discover Off -Market Deals and Meet Turn-Key Property Providers
- Learn About the Latest Technology and its Use in Real Estate
- Meet Founders of Real Estate Companies and Learn Directly from Them
- Gain Insight on News, Trends and Strategies from Experienced Investors and Professionals
- Discover How to Buy Property through Tax Sales and Pay Way, Way Less
- Meet Hard Money Lenders and Get Your Deals in Front of them Here
- Discover Advanced Strategies like 1031s, Self-Directed IRAs, Tax Planning, etc.
- Meet and Mingle with Realty411 writers, contributors, sponsors, supporters, new and long-time subscribers and readers, benefactors, editorial and event staff, and other VIP Members of Realty411 and REI Wealth’ s Network
This is the place to learn real estate investing with experienced investors and real estate professionals who have personally invested both locally and throughout the United States.
Guests who join us will gain specialized knowledge and learning in diverse real estate investing topics and subjects. Our featured educators have decades of personal experience in real estate investing and will answer your complex questions.
If you are serious about personal finance, join us to learn about top markets, success strategies, insider tips, and so much more. The latest edition of Realty411 magazine will be available, as well as past editions, too.
SELF PARKING FOR THIS EVENT IS FREE ONSITE– Plus, there is plenty of parking with overflow parking available nearby. As a bonus, all guests will receive our latest publication.
WANT TO LEARN MORE? VISIT OUR WEBSITE, REALTY411.com or
DOWNLOAD OUR PREVIOUS EVENT PROGRAM – LEARN ABOUT OUR PAST SPEAKERS:
https://joom.ag/dNvd or CLICK HERE.
Our NEW event schedule is being worked on, so be sure to check back or register to receive updates via email. Thank you and see YOU soon!

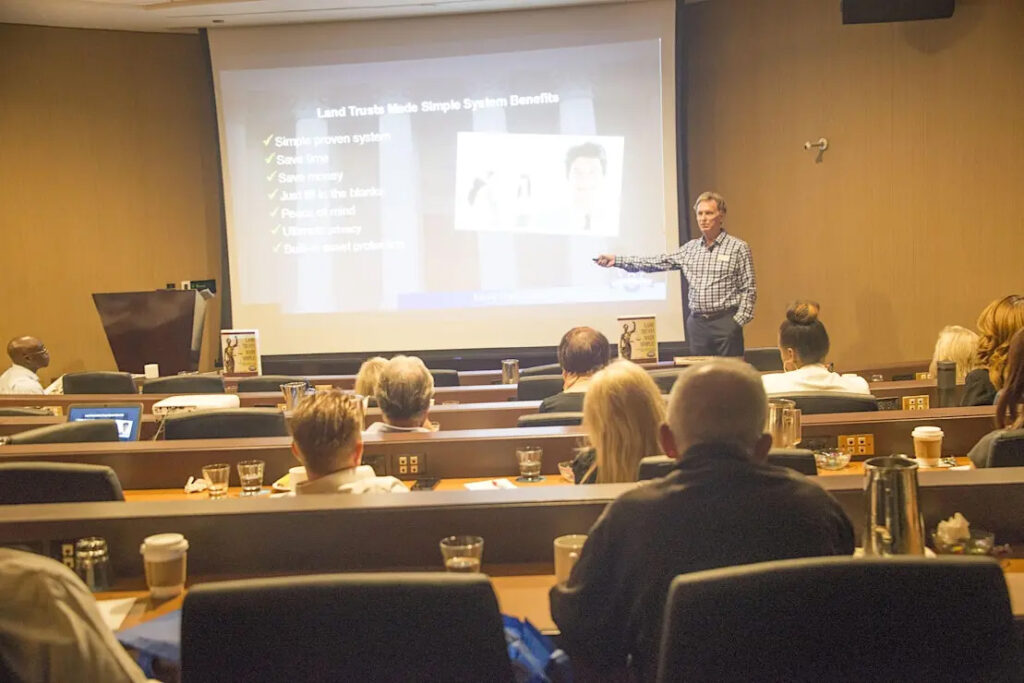
TOP EDUCATION AND INSIGHT FROM PROFESSIONALS
Our top educators are experts in their fields who are ready to share their valuable insight with our guests.
Our guests will also receive our latest publications, enjoy fantastic education, networking opportunities, and gain access to top REI resources.
TOP EDUCATION & MOTIVATION WITH:
Adiel Gorel – ICG REAL ESTATE INVESTMENTS
“How to Build Wealth Working With Inflation, Not Against it, Without Having to Put in Work.”
Ken Letourneau – THE TAX SALE MASTER
“Learn How to Invest in Real Estate with as Little as $5,000 Buying Tax Sales”
Michael Morrongiello – BAY AREA WEALTH BUILDERS
“Get Your Questions Answered About Notes and Creative Financing”
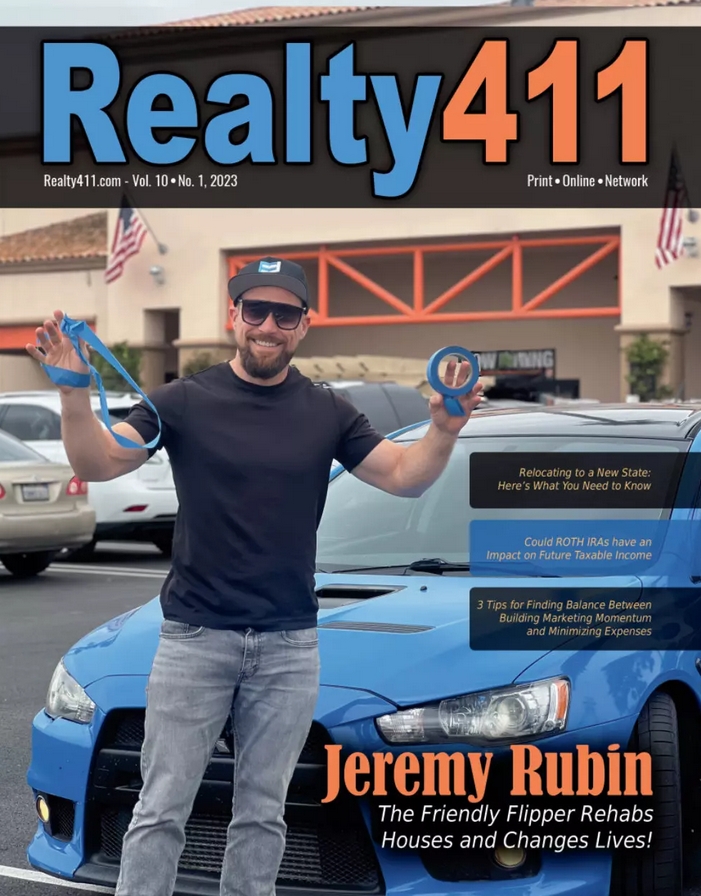
Jeremy Rubin – THE FRIENDLY FLIPPER
Learn How Jeremy was Able to Exit His Corporate Job to Close $100M in Real Estate+
Christopher Meza – REAL TITAN ACQUISITIONS, INC.
Discover Opportunities in Commercial Development in Southern California
Michael Ryan – MICHAEL RYAN & ASSOC.
The Latest News on Property Financing With an Experienced Broker & MLO
Merrill Chandler – GET FUNDABLE
5-Step Business Funding to Get $350,000 in Bank Credit Lines in the next 120 Days
Eric Tran – Universal Commercial Capital
What Loan Officers Need to Know about Non-QM Loan
Zach Henderson – ELUX HOMES
Discover BRAND NEW Turnkey Duplex Rental Properties in Wichita, Kansas
Dr. Tina D. Lewis – The BottomLine Queen
Social Media Expert and Influencer Introduces the L Card for Brokers/Agents
Dana Erhlich – ENRG.realty
Connect with One of the Fastest-Growing Real Estate Agency in the U.S.
DaShunda Morris – Realtor/Rehabber
Realtor or Rehabber? Both! Learn How DaShunda Helps her Clients Sell for More Money
ALL GUESTS RECEIVE DISCOUNTED PARKING TOO!
PLUS, MORE EDUCATORS TO BE ANNOUNCED – NETWORK WITH VENDORS!
Grow your business with Realty411, call 805.693.1497 to participate in this event.
*Please note our speaker schedule may change due to unforeseen circumstances.

Grasp this opportunity to connect, network and learn with top investors!
Pencil in this date now and join us in-person to gain specialized insight and knowledge. The information shared on this SPECIAL day could catapult your portfolio to new levels.
This real estate investing conference has something for everyone regardless of their experience level in real estate. Join this memorable day and receive knowledge for a lifetime.
- This is Your Chance to meet TOP Leaders in REI
- Both Local & National Experts will Attend
- Learn from Leaders & Industry Professionals
- Meet Local PLUS Out-of-Area Investors
- NON-Stop Tips for Real Estate Success
- Bring Lots of Business Cards to Network
This event is produced and hosted by Realty411.com. Since 2007, we have dedicated our time and resources to help expand real estate investing knowledge and education to the masses by producing magazines, virtual conferences, webinars, podcasts, and in-person events. We currently produce six real-estate websites, with Realty411.com capturing nearly 1 million visitors so far. Realty411 has hosted events in 14 states so far.
INVEST YOUR TIME HERE FOR ONE SPECIAL DAY OF NETWORKING & MOTIVATION – TAKE YOUR REI KNOWLEDGE TO A WHOLE NEW LEVEL.
PARKING FOR THIS EVENT IS ONLY $5. Overflow traffic is available at the mall across the street or parking lot next door.

WOULD YOU LIKE TO SPEAK IN FRONT OF OUR LOYAL READERSHIP?
PLEASE REACH US FOR DETAILS AT: 805.693.1497 OR 310.994.1962.

ABOUT US:
REALTY411.com has hosted over 24,000 guests at our events across the nation, according to Eventbrite statistics. Our main website, REALTY411.com has reached close to one million readers, according to third-party website analytics.